Single-Family Home Price Appreciation — Santa Clara & San Mateo Counties
Introduction
For decades, homeownership in Silicon Valley has proven to be one of the most reliable wealth-building strategies available. Single-family homes in Santa Clara and San Mateo Counties have consistently appreciated across every long-term time horizon — through the dot-com bust, the 2008 financial crisis, the COVID pandemic, and rising interest rates.
This analysis examines median sale price data from 2002 through 2025, covering the combined counties, each county individually, two city group composites, and seven individual cities: Menlo Park, Palo Alto, Los Altos, Los Altos Hills, Cupertino, Mountain View, and Sunnyvale.
City Group Definitions
7 Cities Combined includes: Menlo Park, Palo Alto, Los Altos, Los Altos Hills, Cupertino, Mountain View, and Sunnyvale | 4 Cities Combined includes: Menlo Park, Palo Alto, Los Altos, and Los Altos Hills |
The Power of Unlevered Returns
In Silicon Valley, buyers typically put down 20–26% of the purchase price. This means the actual return on invested equity has historically been substantially higher than the already-impressive unlevered figures shown below — every point of price appreciation is amplified across a far larger asset base than the cash actually deployed.
Every appreciation figure in this analysis is entirely unlevered, reflecting raw price gains only. A buyer who purchased at the 2002 combined-county median of $560,000 with a 20% down payment ($112,000) and sold in 2025 at $1,975,000 would have seen a raw price gain of over $1.4 million on an initial cash outlay of $112,000 — before mortgage paydown and tax benefits.
CAGR Summary — All Time Horizons
The table below shows the compound annual growth rate (CAGR) for each geography across all five time horizons. Each chart in this report shows these same CAGR values visually for easy comparison.
Geography | 24-Yr (2002–2025) | 15-Yr (2011–2025) | 10-Yr (2016–2025) | 7-Yr (2019–2025) | 5-Yr (2021–2025) |
Combined Counties | 5.6% | 8.8% | 6.7% | 6.7% | 4.0% |
Santa Clara County | 5.6% | 8.9% | 7.2% | 7.1% | 4.6% |
San Mateo County | 5.5% | 8.6% | 6.0% | 5.4% | 2.7% |
7 Cities Combined | 6.5% | 7.8% | 5.9% | 6.0% | 3.6% |
4 Cities Combined | 6.5% | 7.4% | 5.2% | 5.4% | 3.4% |
Menlo Park | 6.1% | 7.4% | 5.0% | 5.7% | 3.4% |
Palo Alto | 6.9% | 7.4% | 4.9% | 4.3% | 3.0% |
Los Altos | 6.2% | 7.7% | 6.3% | 6.2% | 4.0% |
Los Altos Hills | 5.0% | 6.0% | 3.5% | 3.9% | 1.1% |
Cupertino | 6.2% | 7.8% | 6.2% | 6.3% | 4.2% |
Mountain View | 6.4% | 7.9% | 5.7% | 5.0% | 4.1% |
Sunnyvale | 6.3% | 8.5% | 6.0% | 6.4% | 4.0% |
Color Legend
| Combined Counties |
| Santa Clara County |
| San Mateo County |
| 7 Cities Combined |
| 4 Cities Combined |
| Menlo Park |
| Palo Alto |
| Los Altos |
| Los Altos Hills |
| Cupertino |
| Mountain View |
| Sunnyvale |
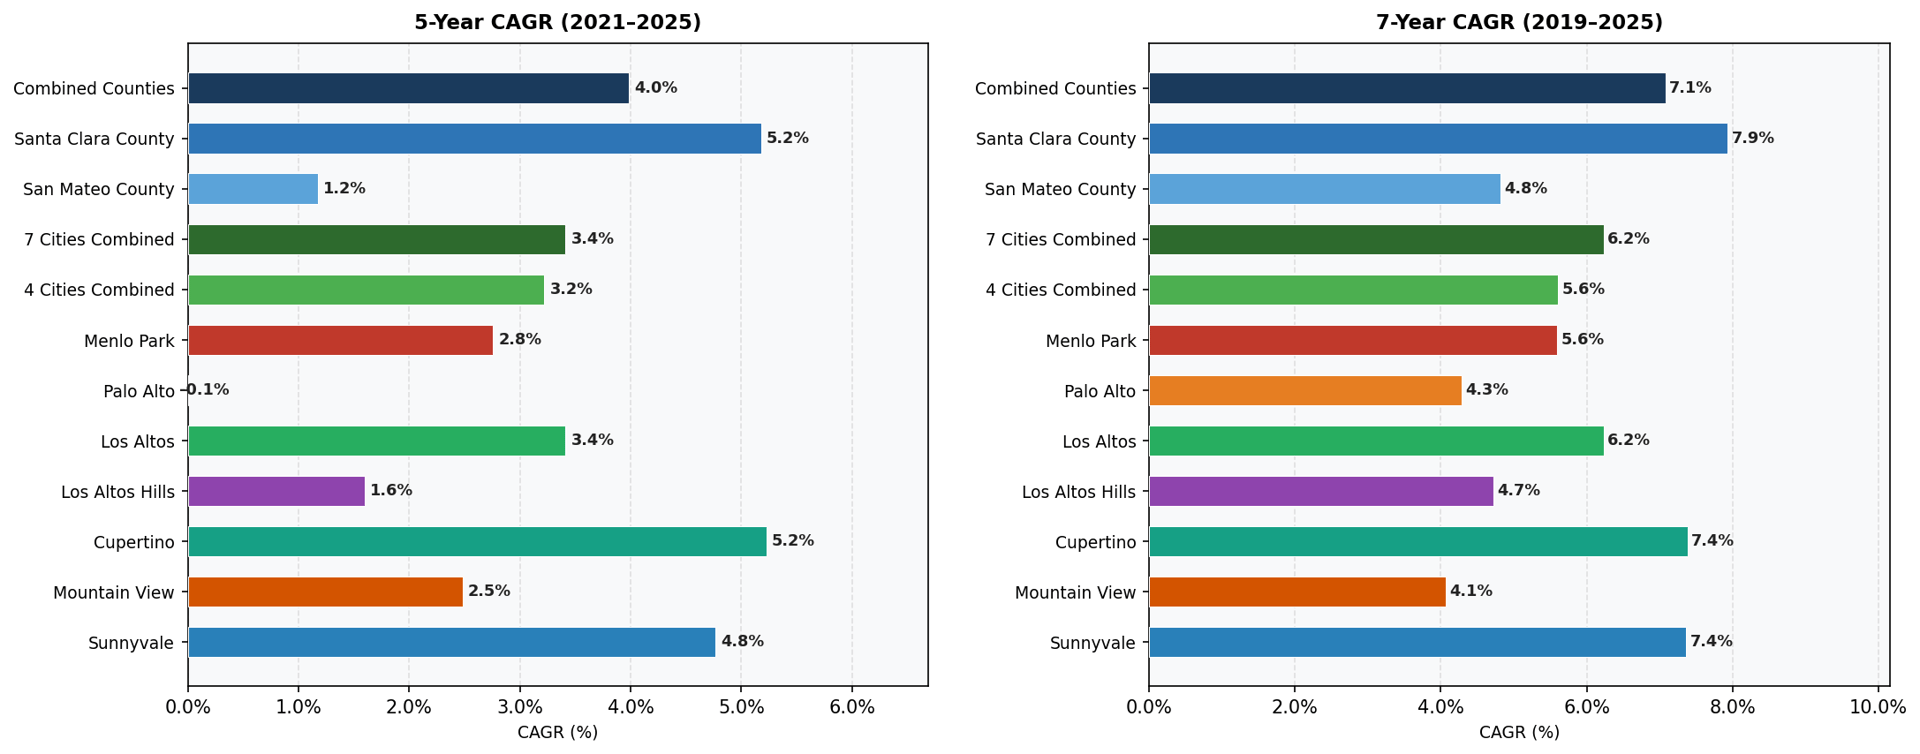
5-Year & 7-Year CAGR
The 5-year window (2021–2025) reflects the post-pandemic surge and subsequent rate shock. The 7-year view (2019–2025) adds the pre-pandemic baseline. Santa Clara County led both counties at 4.6% (5-year) and 7.1% (7-year). Among individual cities, Cupertino and Sunnyvale showed particular strength across both windows.
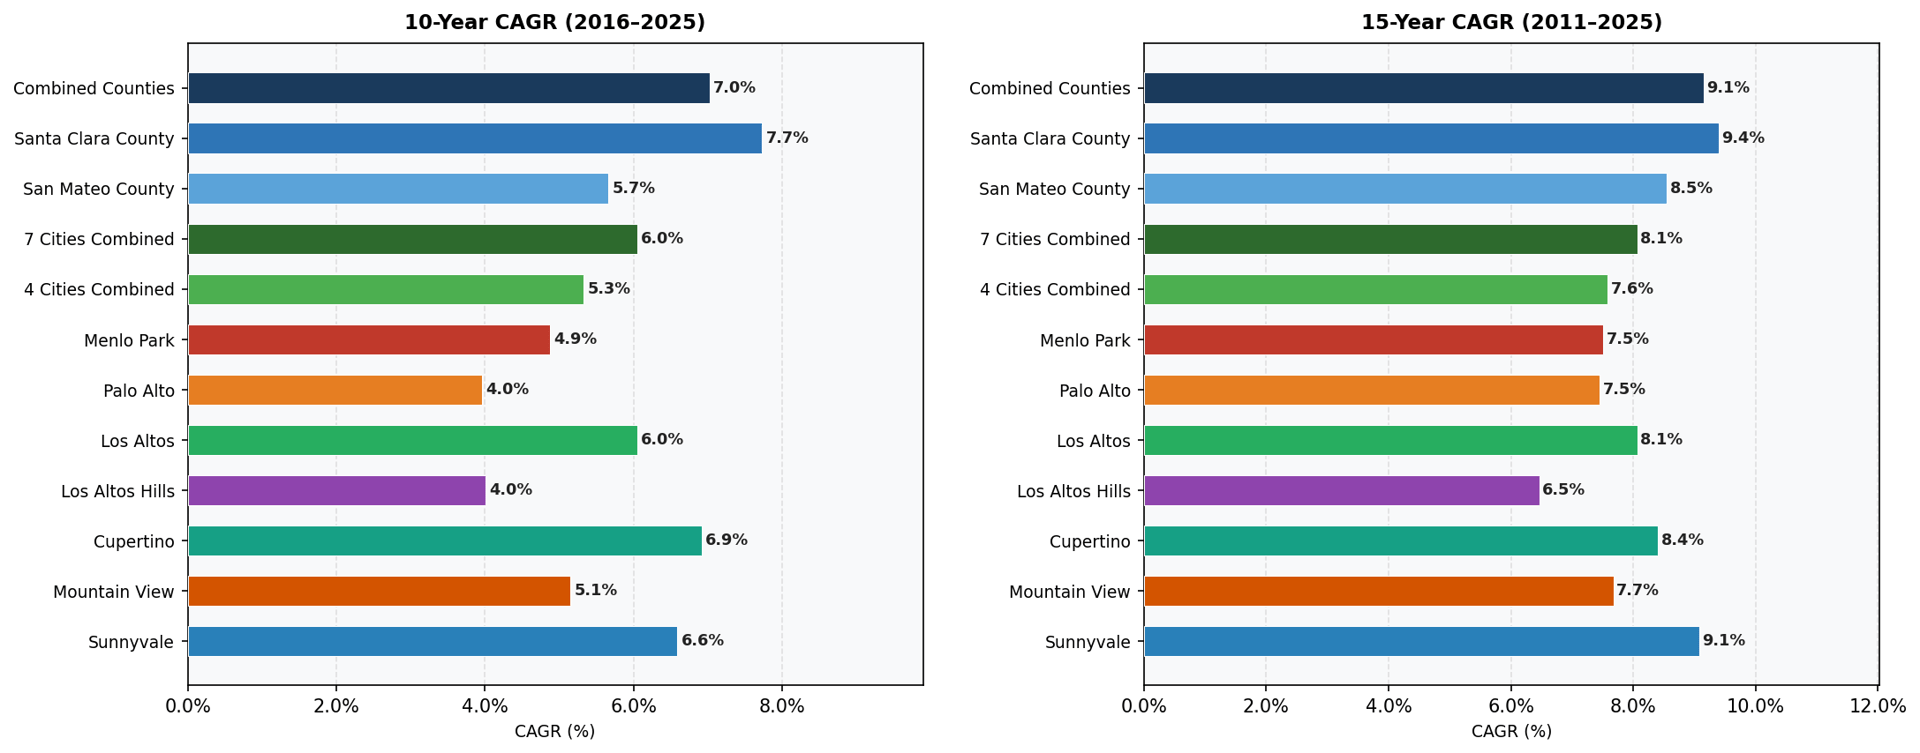
10-Year & 15-Year CAGR
The 10-year period (2016–2025) captures the full force of the second tech boom. The 15-year view (2011–2025) begins at the post-financial-crisis trough — one of the most powerful entry points in Bay Area real estate history. Both counties compounded close to 9% annually over 15 years, with cities like Sunnyvale (8.5%) and Mountain View (7.9%) performing even more strongly.
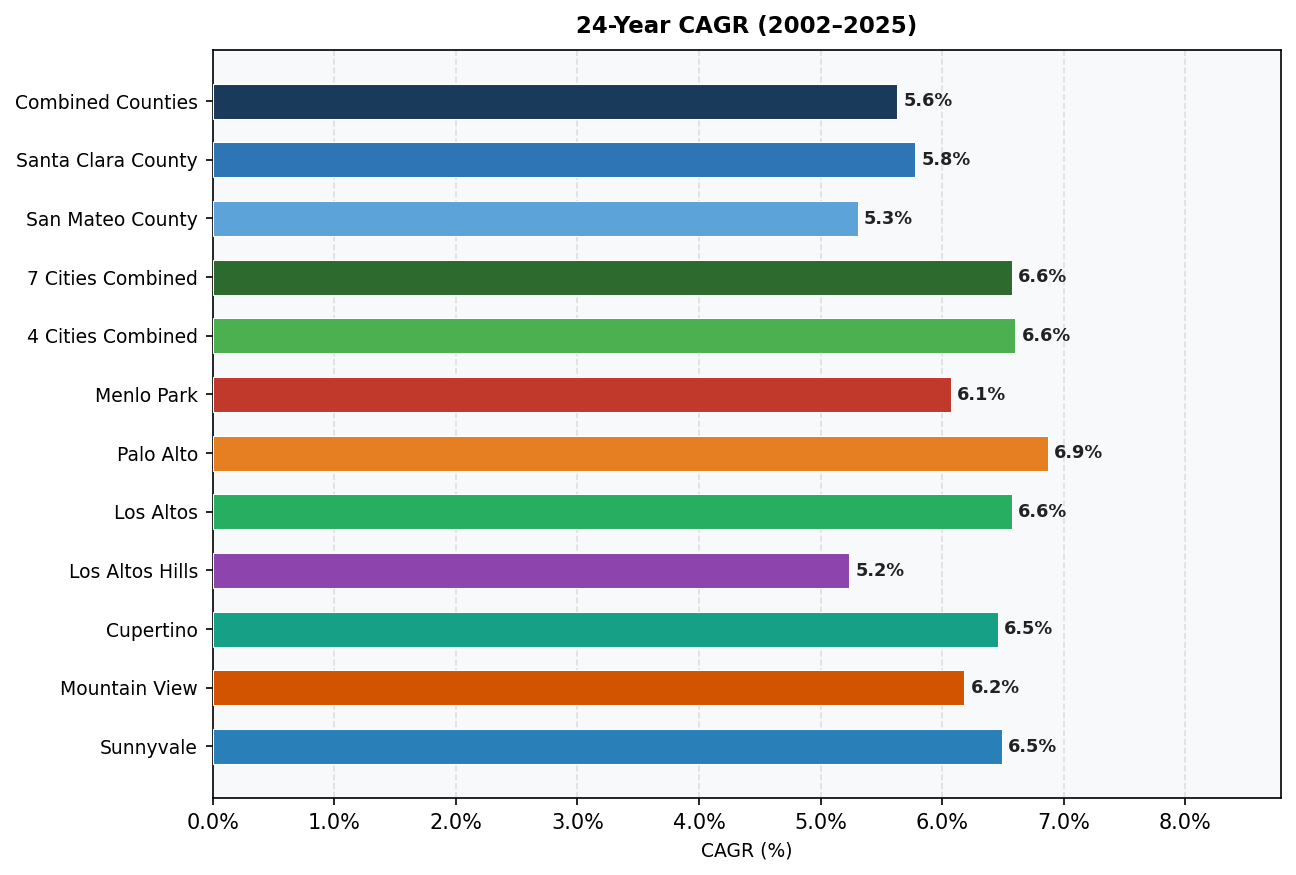
24-Year CAGR (2002–2025)
Spanning two complete market cycles, the 24-year CAGR tells the most complete story of Bay Area real estate as a long-term asset class. Every geography delivered a CAGR of 5% or better — with Palo Alto (6.9%), Mountain View (6.4%), and Sunnyvale (6.3%) leading among individual cities.
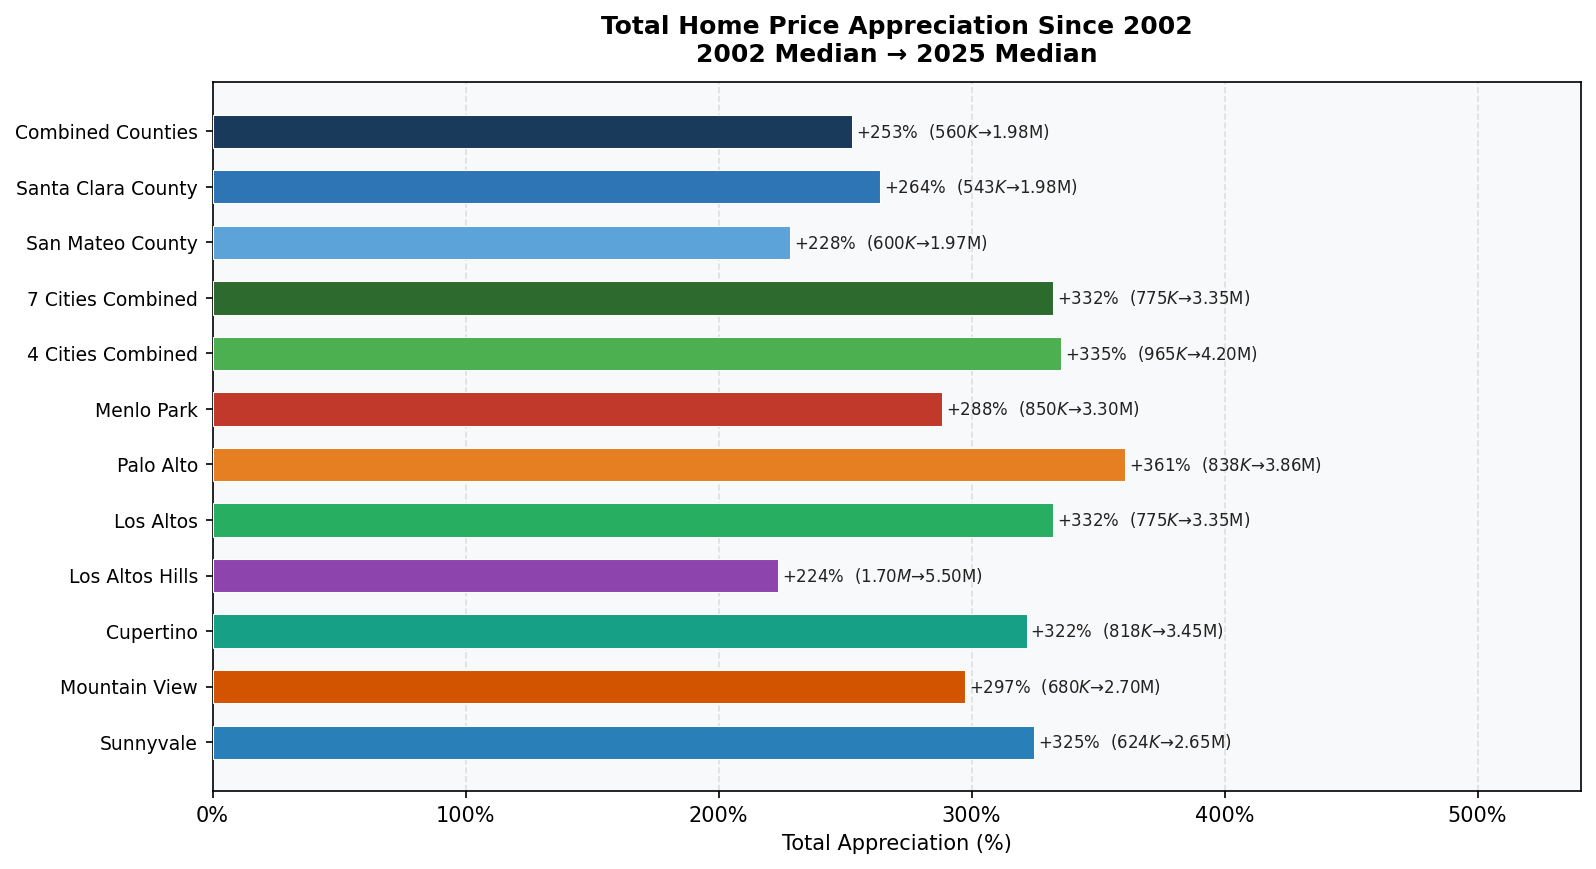
Total Appreciation Since 2002
From 2002 through 2025, every geography tracked in this analysis delivered substantial total appreciation. The chart below shows the percentage gain from the 2002 median to the 2025 median, with exact start and end prices labeled on each bar.
Geography | 2002 Median | 2025 Median | Total Gain |
Combined Counties | $560,000 | $1,975,000 | +253% |
Santa Clara County | $543,000 | $1,976,455 | +264% |
San Mateo County | $600,000 | $1,970,000 | +228% |
7 Cities Combined | $775,000 | $3,350,761 | +332% |
4 Cities Combined | $965,000 | $4,200,000 | +335% |
Menlo Park | $850,000 | $3,300,000 | +288% |
Palo Alto | $837,944 | $3,860,000 | +361% |
Los Altos | $775,000 | $3,350,761 | +332% |
Los Altos Hills | $1,700,000 | $5,500,000 | +224% |
Cupertino | $818,000 | $3,450,000 | +322% |
Mountain View | $680,000 | $2,702,500 | +297% |
Sunnyvale | $624,000 | $2,650,000 | +325% |